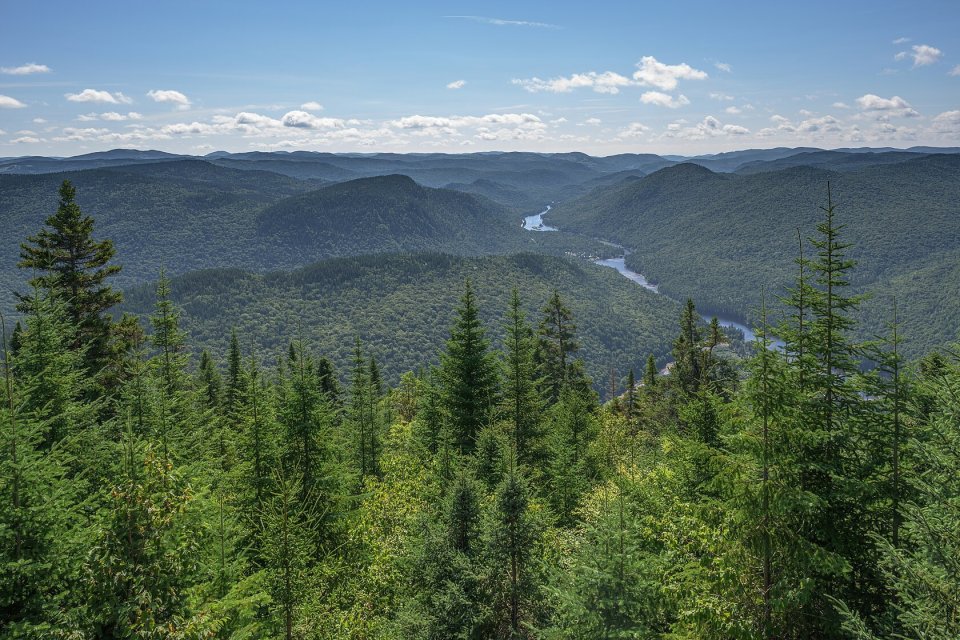
How the palette is calculated
The image is scaled down to about 96 pixels across and its colours are grouped with k-means: the algorithm finds the N colours that best represent all the pixels. The grouping happens in OKLab space, which measures differences the way the eye perceives them; in RGB, two very different greens can look “close” and two near-identical greys far apart. The starting point isn’t random, so the same image always gives the same palette.
Average colour and dominant colours
They’re not the same thing. The dominant colours are the ones covering the most area; the average colour is the blend of all of them, as if the image were shrunk to a single pixel. The average is usually a muted tone that doesn’t appear as such in the photo, but it makes the best loading background: it resembles the image as a whole and doesn’t stand out when the photo arrives. It’s the same colour the ximg.es generator stores for every photo in its bank.
Ideas for using the palette
- Derive a website’s colours from its hero photo or logo.
- Choose a text or button colour that goes with the header image.
- Give each card in a listing a background in the colour of its photo.
- Check whether a set of photos has a consistent colour range.
If you’re going to put text on any of these colours, check the contrast first with the WCAG checker.